 performance-matters
Performance work often gets treated as a polish pass: build the theme, then “make it fast” if there’s time. But a slow page isn’t a finished page with a flaw. It’s the version of the site that most visitors actually get.
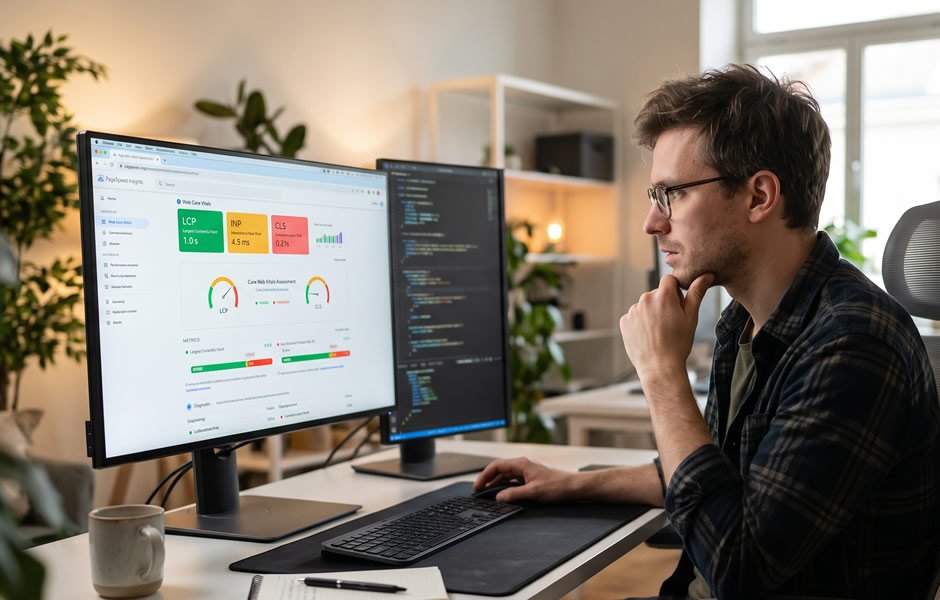
Core Web Vitals are Google’s way of putting numbers on that experience. They aren’t about a score in a report. They measure what a real visitor feels: how long they wait, whether the page answers when they tap, and whether it holds still while they read.
What the three measure
Each metric covers one moment of a visit, measured from real Chrome users rather than a lab test.
| Metric | The moment it measures | Good |
|---|---|---|
LCP |
Largest Contentful Paint: when the main content, usually the hero, appears | 2.5 s or less |
INP |
Interaction to Next Paint: how quickly the page responds to a tap, click or key press | 200 ms or less |
CLS |
Cumulative Layout Shift: how much the layout jumps while the page loads | 0.1 or less |
A page passes when at least 75% of real visits hit all three. Google doesn’t average them, so one poor metric fails the page even if the other two are fine. INP replaced the older First Input Delay metric in March 2024.
Why visitors care
Each metric lines up with something a visitor does when a page goes wrong:
- Slow LCP: they stare at a blank or half-drawn screen, and some leave before the page appears.
- Slow INP: they tap a menu, nothing happens, so they tap again, and now two things open.
- High CLS: they reach for a link, a late image pushes it down, and they click an ad or the wrong button.
None of this shows up on a developer’s laptop on fast Wi-Fi. It shows up on a mid-range phone on a patchy mobile connection, which is where much of a site’s traffic comes from.
Why Google cares
Google’s page experience documentation says plainly that Core Web Vitals are used by its ranking systems. It’s one signal among many, though. Good scores don’t guarantee rankings, and helpful content still comes first. Think of it as a tie-breaker you don’t want to lose, not a shortcut to the top.
Ranking uses field data, the numbers from real visits. The Lighthouse score in PageSpeed Insights is a lab test: useful for finding problems, but not what Google ranks on.
Why the business cares
Speed shows up on the bottom line. Milliseconds Make Millions, a Google-commissioned study by Deloitte Digital and fifty-five, tracked 37 European and American brand sites across more than 30 million mobile sessions. When pages got 0.1 seconds faster on the speed metrics it measured, people moved further through the funnel in every vertical:
| Vertical | After a 0.1 s improvement |
|---|---|
| Retail | Conversion rate up 8.4%, and shoppers spent 9.2% more |
| Travel | Conversion rate up 10.1% |
| Luxury | 40.1% more visitors went from a product page to Add to Basket |
| Lead generation | 21.6% more visitors reached the form submission page |
Fast reads as premium
The luxury result is the one to remember. Of every vertical in the study, luxury brands were the most sensitive to speed. Those are the sites with the most invested in design and brand, and a slow page undercuts all of it. A brand that charges a premium has a premium to protect.
Visitors make the same connection. In a late-2024 consumer survey by the host Liquid Web, just over half said a site’s speed reflects the brand’s quality. Three in four said they’d wait longer for a brand they know and love, but half said they had lost trust in a brand for good after one to five poor website experiences.
So a slow site costs the brand twice. New visitors judge it before they know anything else about the business, and loyal customers only forgive it a few times.
Why it’s the theme’s job
Plugins and content add weight, but the theme sets the baseline every page starts from. Most Core Web Vitals problems are decided in theme code:
- LCP: whether the hero image is prioritized or lazy-loaded, and whether a hero video downloads before the poster paints.
- INP: how much JavaScript loads on every page, whether it’s needed there or not.
- CLS: whether images carry width and height, and how web fonts swap in.
That’s why the Performance Bar series exists. Each recipe takes one of these decisions and shows how to make it in a WordPress theme.
Before you ship
- Test on mobile, not just desktop.
- Check field data in Search Console once the site has traffic, not just a Lighthouse run.
- Look at all three metrics. One poor metric fails the page.
- Re-test after adding plugins, tracking scripts or new templates.
- Note conversions before speed work, so you can show what it changed.
Fast isn’t something you add at the end. It’s the order you build in. The house rule